Search our catalog of QMods, financial widgets that create powerful client experiences.
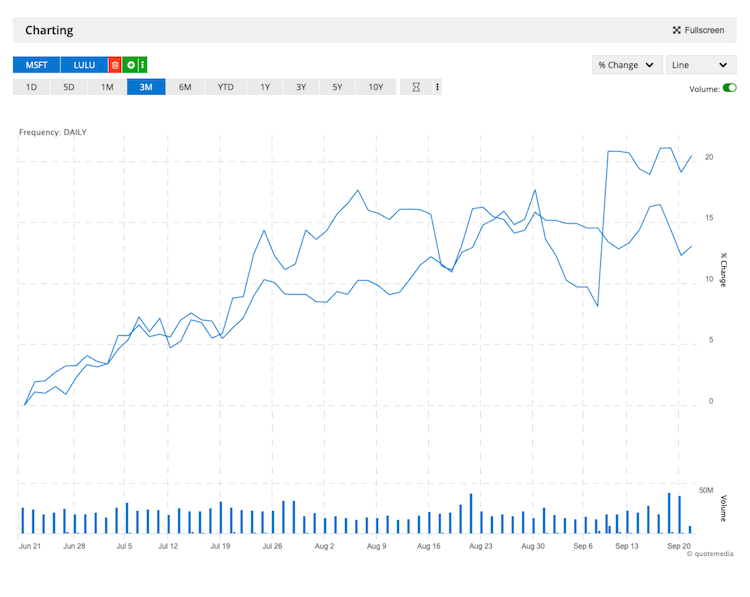
Compare up to five symbols with customizable chart types and advanced indicators, perfect for analyzing trends, momentum, and events to uncover lucrative opportunities.
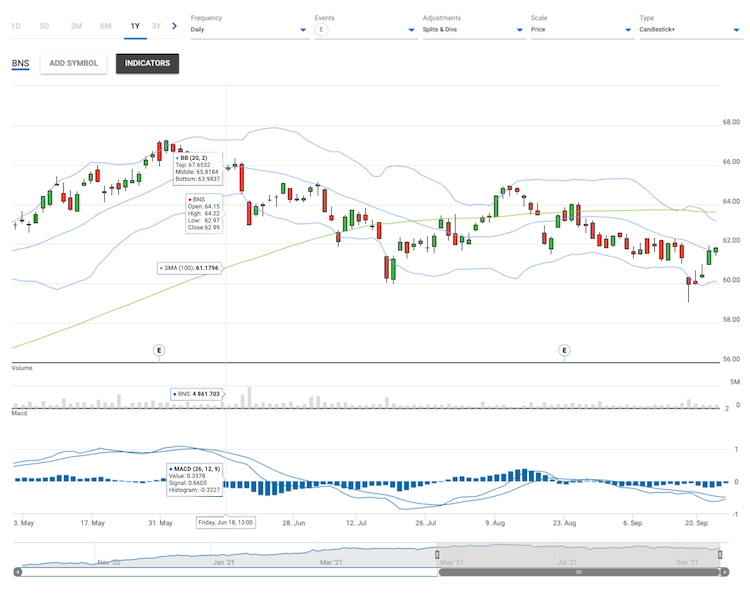
Analyze asset performance across multiple timeframes using customizable chart styles, symbol comparisons, and event overlays for dividends or earnings.
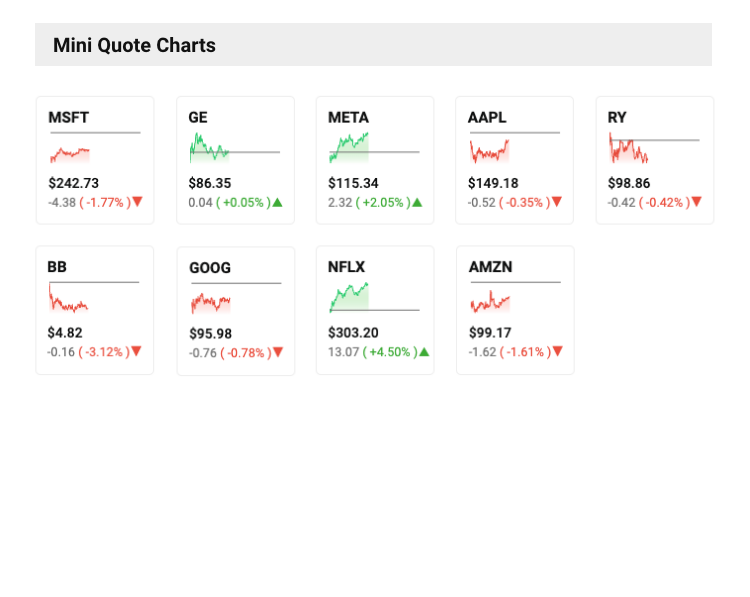
Display live quote data alongside a small, integrated chart for a quick, at-a-glance view of market performance.
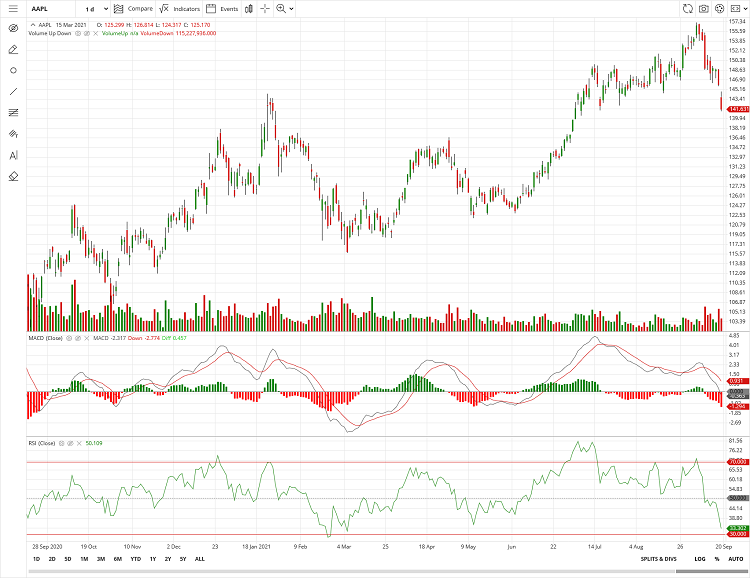
Use a full-featured charting library with hundreds of indicators, drawing tools, and comparison options for analysis.